
Introduction
In a previous blog post we explored the concept of Continuous AI Assurance through the metaphor of a futuristic AI production factory operating in safety critical domains. We envisioned AI systems as glass cubes moving on conveyor belts within this factory. The entire assembly – conveyor belts, inspection instruments, and all – symbolized our Continuous AI Assurance system. The primary objective of this framework is to thoroughly examine these AI systems, dissecting their components down to the minutest detail to evaluate both their individual and collective functionalities.
The Start of the Research Process
In this blog post, we take a significant step forward by actualizing this vision. The idea of Continuous AI Assurance has matured organically alongside my research phases, all centered on the critical question of how to rigorously evaluate the functionality of AI/ML software components. This quest began with a seminal paper by R. Kaur and colleagues, titled “Assurance Case Patterns for Cyber-Physical Systems with Deep Neural Networks”. The authors of this paper tackled the challenge of verifying the safety of Cyber-Physical Systems (CPS) incorporating one or more Deep Neural Network (DNN) elements.
What Is a Cyber-Physical System?
To visualize this, imagine a car equipped with integrated software components and multiple driving assistant systems. Similarly, a CPS could be a medical device, and industrial robotic system, or any number of analogous entities deployed in safety-critical environments.
The Base of the Study
While Kaur et. al.’s paper primarily focused on the provable verification of safety for CPS with DNNs, it spurred me to adopt a more expansive view of the verification and validation processes for modern systems incorporating ML elements. This broader perspective integrates safety verification as a pivotal but not singular aspect of AI assurance. Consequently, I – in close collaboration with colleagues with diverse research and development roles – embarked on an extensive study into various AI/ML assessment tools, which we categorized into four distinct types:
- Diagnostics: Tools that analyze the AI/ML element according to its decision-making patterns.
- Uncertainty Estimation: Tools that assess and quantify the uncertainty inherent in the decisions made by the AI/ML element.
- Robustness Verification: Tools that evaluate and measure the robustness of AI/ML decisions under various perturbations applied to the inputs.
- Safety Verification: Tools that provably verify the safety of AI/ML systems concerning pre-defined properties, such as mathematical characteristics that correlate specific inputs to anticipated outputs.
In this post, I will start to lay out the rationale behind the Diagnostics as a first pillar of the AI Assurance Framework by sample tools in that domain. In the then upcoming blog posts, I will conduct this in a similar manner for the other three pillars of the framework.
Diagnostic Evaluation Tools
The objective of diagnostic tools is to render the decision-making patterns of AI/ML models transparent. This transparency is particularly crucial for deep learning models, which are often referred as “black box” models due to their complex and opaque inner workings. Appropriately tracking and understanding the decision-making processes of these models is fundamental for their reliable and trustworthy deployment.
Within the diagnostics category, we classify the tools into two sub-categories:
- Decision Explainability Tools: These tools aim to extract and visualize the patterns dictating the model’s decisions. For example, these could highlight the regions of a medical image that are crucial for classifying a disease.
- Model Diagnosis Tools: These tools delve into the mechanisms at play within the model during decision-making. They can assess the training effectiveness of explicit layers in a deep neural network, identifying whether layers are under-trained, over-trained, etc.
Let us explore now some pivotal tools within these sub-categories.
Decision Explainability Tools
Our work with trustworthy AI has primarily centered on computer vision. Subsequently, our research into explainability tools also focused on those optimized for application within the computer vision domain, although many of these tools apply widely across varied AI/ML contexts.
Layer-wise Relevance Propagation (LRP) – a computer-vision focused explainability tool
Layer-wise Relevance Propagation (LRP) is one such method, specifically developed for computer vision at the Fraunhofer Heinrich Hertz Institute (see in the paper for details about the method). LRP visualizes the contribution of individual pixels to the model’s predictions through heatmaps. As noted in a technical paper, the authors characterize LRP as follows:
“… We introduce a methodology that allows to visualize the contributions of single pixels to predictions … These pixel contributions can be visualized as heatmaps and are provided to a human expert who can intuitively not only verify the validity of the classification decision, but also focus further analysis on regions of interest.”
Without diving into the technical nuances of LRP, we illustrate its application with an example (for more examples see the basic repo and the pytorch repo).
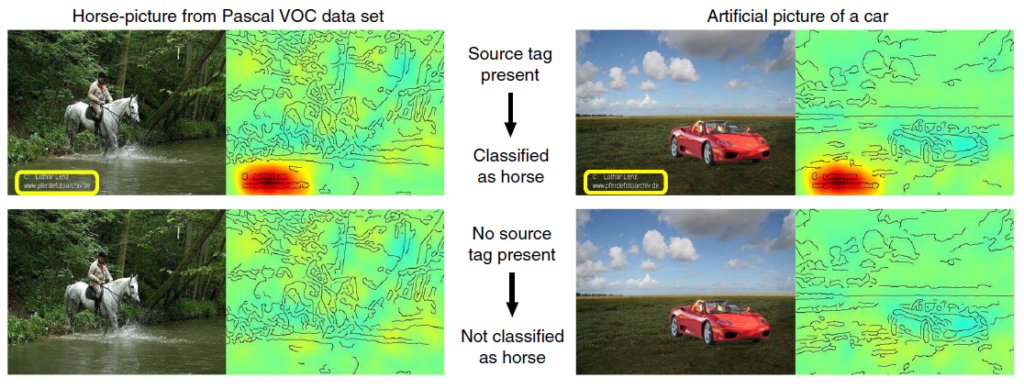
As observed, the model’s classification relies inaccurately on an artist’s tag appearing consistently in the training data images involving horses. When the tag is removed, the classifier fails to recognize the horse, demonstrating a typical example of unintended shortcut learning. This issue underscores the model’s tendency to exploit easy, non-generalizable patterns from the data, thus compromising its reliability.
Such challenges are not confined to trivial cases. For instance, an AI algorithm designed to detect lung diseases in X-ray images might incorrectly rely on a hospital tag instead of pertinent lung regions. In autonomous driving, an algorithm might misclassify traffic signs based on irrelevant background patterns.
Tracking and mitigating these unintended shortcuts early in the AI/ML development process is paramount for ensuring trustworthy development. Tools like LRP play a vital role within an AI Assurance Framework by highlighting potential issues for further inspection and resolution.
SHapley Additive exPlanations (SHAP) – a versatile explainability tool
Another extensively developed tool is SHapley Additive exPlanations (SHAP). SHAP (see the paper, the source repoand documentation page) offers a significant advantage: its versatility is reaching across diverse AI/ML use-cases, extending beyond computer vision to use-cases in other domains like time-series analysis, analysis of audio and text input data, and many more. The SHAP repository, documented extensively online (see the documentation page), facilitates straightforward installation and usage across various applications.
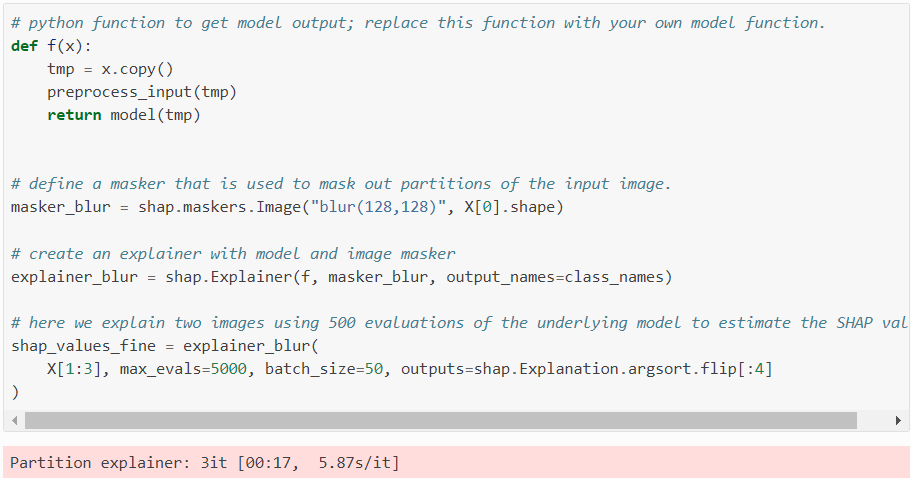
Consider an instance using SHAP to explain a ResNet50 image classification model. Below is a code snippet employing the SHAP Partition Explainer for this purpose:
Visualizing these SHAP values:
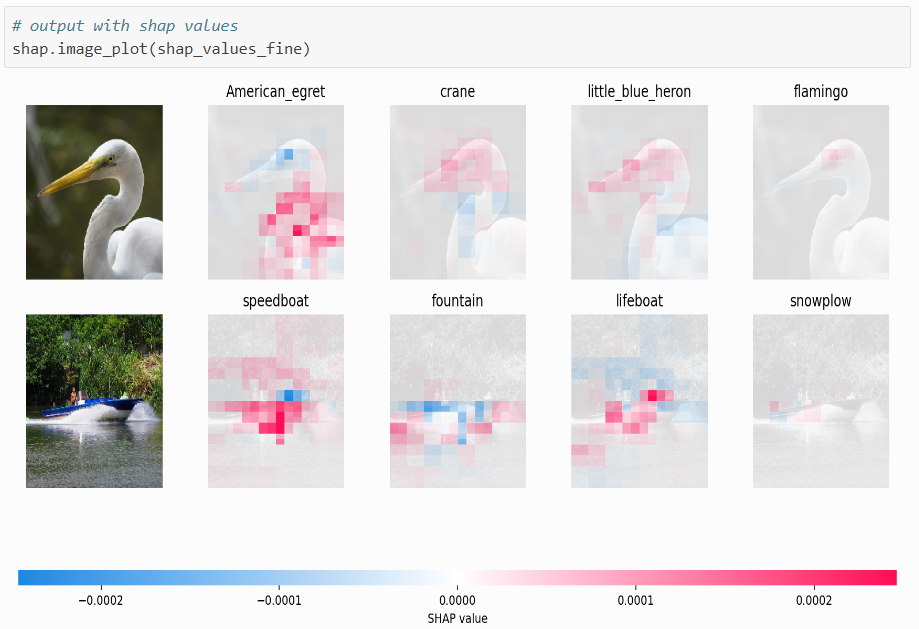
In the plot generated, red pixels signify positive SHAP values, which increase the probability of the class prediction, while blue pixels represent negative SHAP values, reducing the probability of the class. According to the documentation page:
- The first image is classified as an American Egret, influenced by the “bump” over its neck, as highlighted by SHAP values.
- The second image is classified as speedboat, with SHAP values highlighting the distinct boat shape.
SHAP’s broader applicability and ongoing support with a permissive license make it a robust choice for various AI/ML explainability needs, not limited to computer vision.
Conclusion
Tools like LRP and SHAP exemplify the potential within the realm of decision explainability. They enable us to visualize and understand decision patterns in modern AI/ML algorithms, essential for maintaining trust and transparency. While we highlighted LRP’s computer vision focus and SHAP’s versatile applications, there are also other similar tools that can serve as critical components in a continuous AI Assurance Framework, demonstrating the broader spectrum of available tools in the field.
Model Diagnosis Tools
Model diagnosis tries to demystify AI/ML algorithms. Traditional machine learning models, such as logistic regression or support vector machines, inherently offer transparency, making their mechanisms readily interpretable. This clarity, however, tends to disappear when dealing with more complex models like DNNs.
Information Bottleneck (IB) Theory of Deep Learning
Despite DNN’s opacity, the last decade has witnessed a surge in efforts to illuminate their inner workings. A seminal contribution in this realm is the Information Bottleneck (IB) Theory of Deep Learning, pioneered by Naftali Tishby and his team. Rooted in Information Theory, this approach seeks to uncover the fundamental mechanisms driving the optimization of DNNs through deep learning.
Introduction to the IB Theory
The IB theory posits that deep learning algorithms compress the extensive data distribution into a succinct representation, enabling efficient model inference. It hinges on two types of mutual information: one between the hidden layers and the input data, and another linking the hidden layers to the output labels.
According to IB theory, deep learning involves a dual-phase process: an initial enrich phase, where the network absorbs substantial input and label information, followed by a compression phase, where input data information is minimized while label-related information is enhanced. This framework offers a compelling explanation for the deep learning process and sheds light on phenomena such as shortcut learning.
Further research on IB Theory
While the IB theory is promising, it remains a subject of ongoing debate and refinement. Since its introduction, it has spurred further research, discussions, and critical examinations. Papers on the IB theory (IB paper 1 and IB paper 2) have been both scrutinized and extended, such as through critical papers (see critical paper on IB) and further exploratory research, including variational approximations by Alexander Alemi and colleagues (see Deep VIB paper), and very recently a framework for IB analysis developed by Ivan Butakov and colleagues (see IB Analysis Framework paper).
A nice and compelling depiction of the IB mechanism is shown in the following figure that is taken from an article from Quanta Magazine.
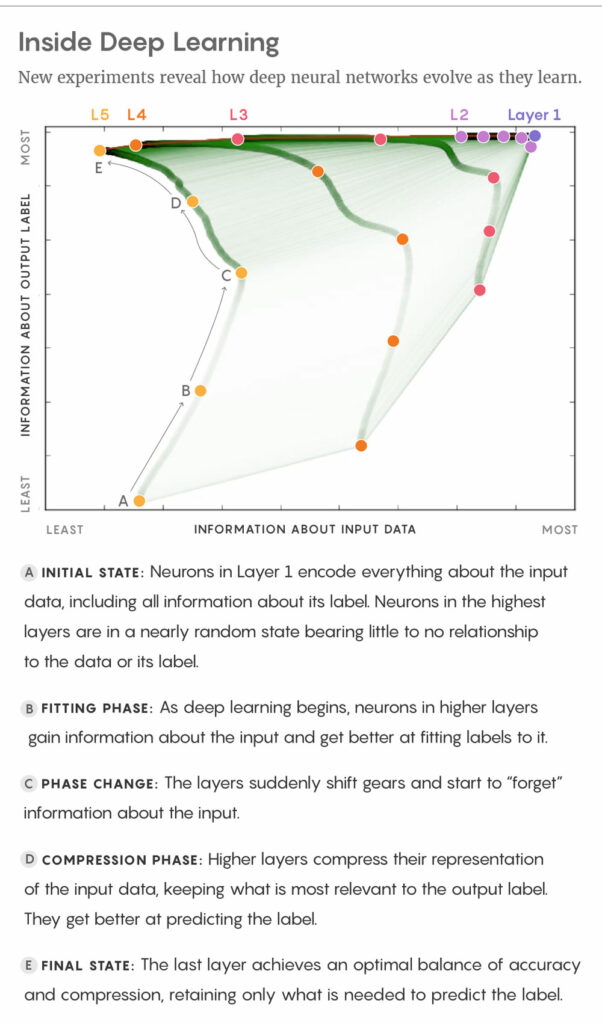
FITTING PHASE: As deep learning begins, neurons in higher layers gain information about the input and get better at fitting labels to it.
PHASE CHANGE: The layers suddenly shift gears and start to “forget” information about the input.
COMPRESSION PHASE: Higher layers compress their representation of the input data, keeping what is most relevant to the output label. They get better at predicting the label.
FINAL STATE: The last layer achieves an optimal balance of accuracy and compression, retaining only what is needed to predict the label.
Though the development of IB theory and related research promises an operational framework potentially integral to AI assurance, we continue our search for more established tools ready for immediate application. Nevertheless, those who have interest in diving deeper into the IB theory can look into a two part Blog that I wrote a couple of years ago (part 1, part 2).
WeightWatcher (WW) – a versatile DNN diagnosis tool
One such promising tool is WeightWatcher (WW), designed for the diagnostic analysis of DNNs. Detailed in a Nature Communications paper, WW provides a comprehensive set of features without needing access to any data (training or test) for analysis. According to its GitHub page some features are:
- Analysis of trained models across various frameworks (e.g., TensorFlow, Pytorch).
- Monitoring of performance for the whole model and each model layer to investigate under- or over-training.
- Prediction of test accuracies across different models, using either data or no data.
- Detection of potential issues after compression or fine-tuning of pre-trained models.
- And more.
The tool can be easily installed in a python environment via pip:

Below is a basic example of using WW in Python:
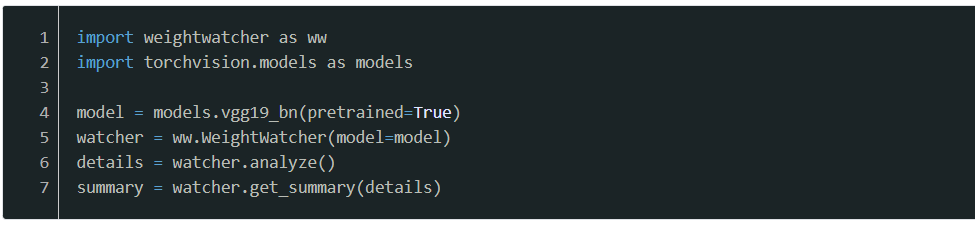
In this code snippet, after importing WW and PyTorch vision models (line 1 and 2), the pre-trained VGG 19 model is loaded (line 4). The WW module then analyzes (line 5) and summarizes (line 7) the model’s layers.
Below we see a sample details table that shows all WW parameters per each model layer:
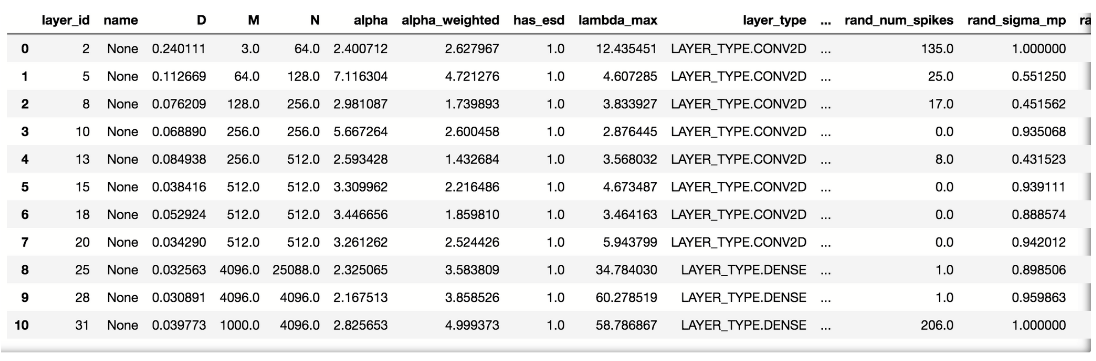
This table is an extensive quantitative documentation of the performance for each model layer. We will not dive deep into the technicality of each parameter of the table. These details can be found in the papers on WW or the documentation pages of the tool.
Similarly, the summary object is a python dictionary containing the most important WW analysis parameters:
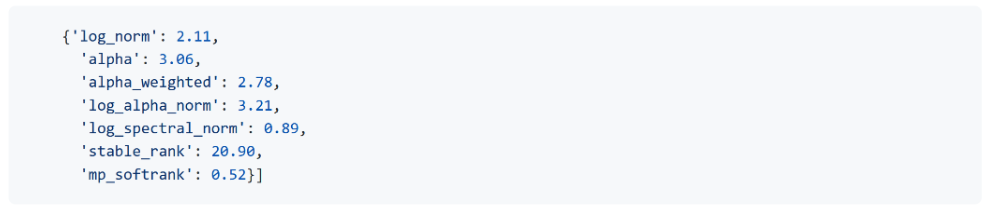
Both the summary dictionary as well the table contain one key WW parameter, namely the “alpha” parameter that is paramount in assessing training quality for the whole model (summary dictionary) or each layer (details table). According to the theory, an alpha value between 2 and 6 indicates well-trained layers, values above 6 suggest under-training, and values below 2 indicate over-training.
The empirical spectral density (ESD)
Additionally, WW outputs qualitative plots like the “Empirical Spectral Density” (ESD) for each model layer. The ESD is a histogram of eigenvalues from each layer’s correlation matrix, with the alpha parameter derived from fitting a power law to the tail of these ESDs. Below is an example ESD plot in log-log scale (left) and lin-lin scale (right):
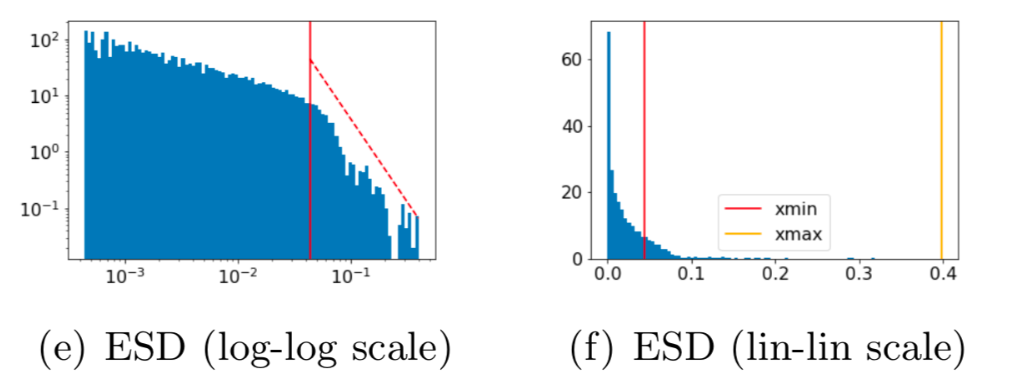
An essential indicator of a well-trained model layer is shown in this ESD sample via the good power law fit of the ESD tail (red dashed line on the left panel) on the one hand and by the wide separation between the minimum and maximum Eigenvalues (respectively, the red and yellow vertical lines on the right panel of the above figure) on the other hand.
Tracking the alpha value
The WW alpha metric can also be utilized to track the model training process. Monitoring the alpha value may enable early stopping the training process whenever the alpha value is falling below 2. An example of such a monitoring of the alpha value is shown below along with the training and test loss metrics:
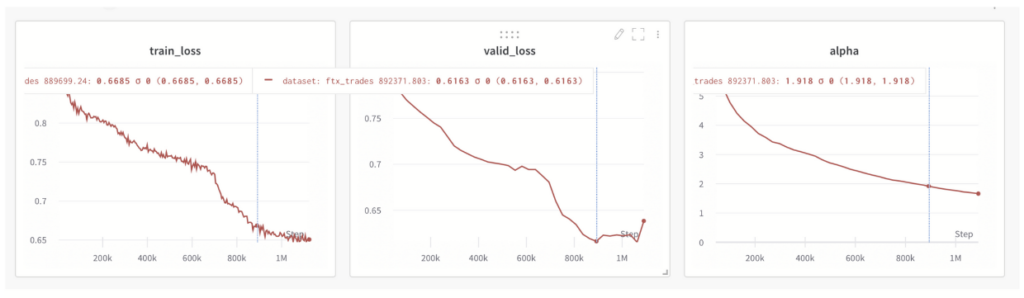
One can observe here that alpha decreases in unison with the training and test losses. But, once the test loss reaches saturation, alpha falls below the value of 2.
Conclusion
The tools discussed – ranging from theoretical frameworks like IB theory to practical diagnostics tools like WW – form a cornerstone in enhancing our understanding with respect to the AI/ML models’ inner workings. These tools are imperative for ensuring that DNNs, despite their complexity, can be reliably evaluated and improved. As we continue to refine these methods, they will increasingly facilitate the trustworthy deployment of sophisticated AI systems.
Outlook
Having explored the landscape of diagnostic evaluation tools for AI, particularly SHAP (SHapley Additive exPlanations) and WeightWatcher (WW), we have laid the groundwork for understanding their functionalities and potentials in enhancing safe and trusworthy AI development within a framework for AI Assurance. SHAP stands out for its universal applicability across various machine learning models, leveraging concepts from game theory to provide local explanations for model predictions. WeightWatcher, on the other hand, provides layer-wise analysis of neural networks, offering insights into whether the network layers are over-trained, under-trained, or optimally parameterized .
Further Study
In an upcoming post, we will dive deeper into practical applications of these tools in safety-critical domains—autonomous driving and medical diagnostics. Specifically, we will demonstrate the application of SHAP and WeightWatcher on traffic sign detection for autonomous vehicles, a task crucial for ensuring the safety and reliability of self-driving technologies. Additionally, we will explore the use of these tools in detecting pneumonia from X-ray images, showcasing their capabilities in the medical domain where the precision and reliability of AI models can significantly impact patient outcomes.
These case studies will not only exhibit the practical utility of SHAP and WW in real-world scenarios but also underscore the importance of robust AI evaluation methods in developing trustworthy, safe, and effective AI systems. Stay tuned as we delve into these applications and illustrate the transformative potential of rigorous AI diagnostics.
Author info