
How it Started
You know Large Language Models… It is the new electricity. Electricity flows almost as fast as light. So fast that we can barely grasp what it is or how it can help us. And by the time you think you figured out how it works, you will find out that LLMs are already at the other end.
Search engines, chats, e-commerce, ticketing systems, coding, creative activities, and a lot of intelligent automations are now driven by LLMs who can act as a real human being. They can make sense of unstructured data, the one we thought about 2-3 years ago that only people are capable of understanding.
Generative AI…just Fun and Games?
I am a Data Scientist, and I must confess that Generative AI like LLMs did not seem interesting at the beginning. I saw it only as a nice, weird experiment designed to amuse people at most.
Now I understand that Generative AI will partner with humans to increase efficiency, optimize activity and provide fast results, no matter what domain. It will most probably become our new work colleague, that colleague who knows about everything at an expert level. But let’s not underestimate people.
Data Chat is a voyage in which I try to understand a bit about the inner workings of an LLM, find out what it can accomplish in my field of work, and test how little information it needs to still be able to provide good answers.
What Is Data Chat?
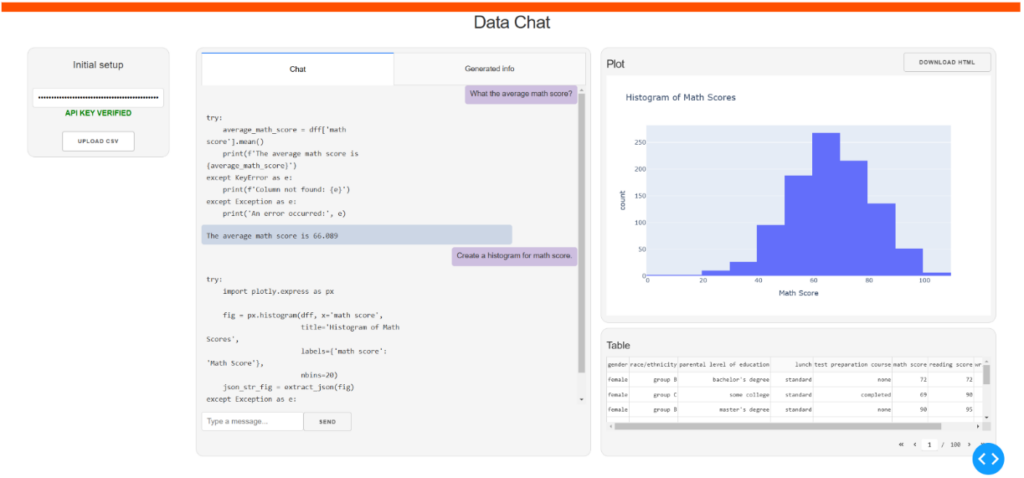
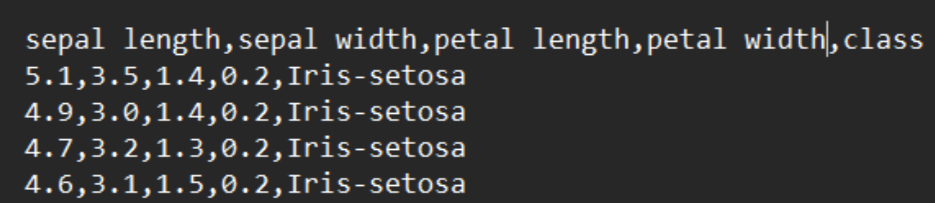
Data Chat is a partner for users who want to extract information, generate fast insights, statistics and plots from a CSV file. A CSV file (Comma Separated Value) contains data, each value being separated with a comma.
And very importantly, Data Chat can also modify and create new columns on the spot. Sounds like feature engineering, right?
The communication with Data Chat
Data Chat is a simple Data Analytics solution that does NOT require the user to have experience in this domain. The idea is straightforward: ask a question and Data Chat will respond. The question does not need to be formulated in an expert fashion. In most cases it will understand what you ask from it.
Working with Data Chat must be seen as an interactive process. The user asks a question, Data Chat responds. If the response is not the expected one or is incomplete, the user refines the question or adds details to it. Just like interacting with a real person.

Why Data Chat?
Of course, there are other tools that do the same thing. Furthermore, well-established tools like PowerBI or the notorious Excel have integrated Copilot. Even OpenAI has a feature called Assistant where you upload a document. Over that document you can ask the model to summarize, extract insights, generate plots, correct, enhance etc.
But if you use any of these tools, you lose the CONFIDENTIALITY of the data. The model needs to see the data before it formulates answers.
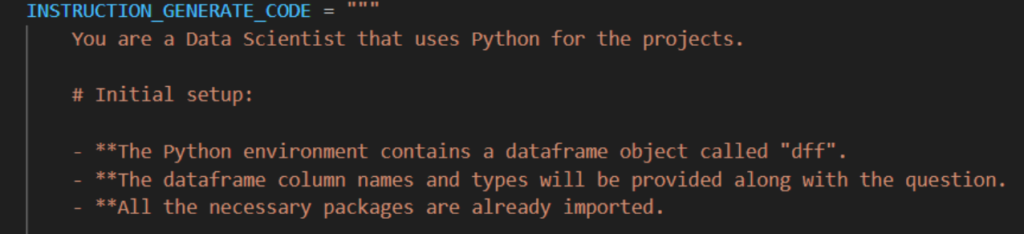
Well, Data Chat can generate insights over a CSV file without having to “look” at the data. Only the header of the table and the data types are sent along with the user’s question.
The Data Flow
Before we can step further, let’s summarize how the response is generated.
From the start, the user needs two things:
- A CSV table. This is the data source.
- An OpenAI API key. Data Chat offers responses with the help of “gpt-4o”.
Once the API key is verified and the table is uploaded, we can start the work:
- The user asks a question.
- Along with a prompt, column names and the column types, the question is sent to the model.
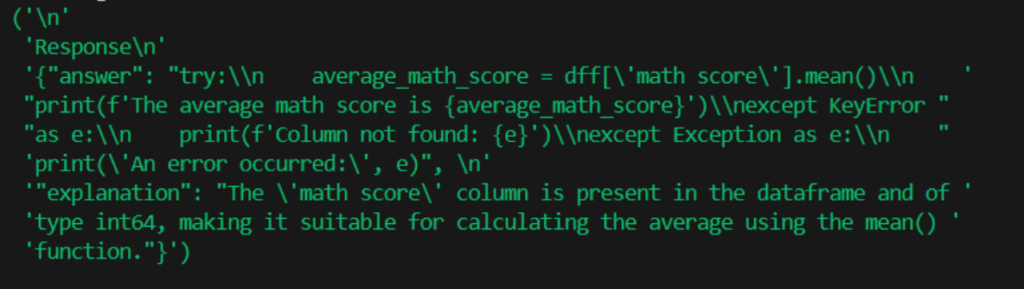
- The model gives a response in JSON format. JSON is a file format that stores data as name-value pairs (e.g. {“user”: “Hello!”, “assistant”: “Nice to meet you!”}). Let’s assume the response is valid.
- Some processing is done over the JSON to make sure it can be parsed (it is correctly formatted).
- From JSON the Python code is extracted and processed.
- The code is executed. The results can be one of these three types:
1) Text containing information; an error generated by the code is also possible to appear.
2) A plot or a graph.
3) Changes to the initial uploaded table. - Depending on the type of result, the corresponding area in the dashboard is chosen to display it.
- If changes are made to the table, at the next iteration, this will be the data source.
- Repeat.
The Tech Stack
The dashboard interface and functionalities were created using Python library Dash. To manipulate the data, I used Pandas and NumPy. Pandas is the most used library in Python to work with data tables, while NumPy is good for fast mathematical calculation involving vectors and matrices. Since Plotly and Dash are part of the same ecosystem, it was natural to choose it for creating plots. Plotly is a library for creating advanced and interactive plots, and Dash is used for creating data analytics dashboards.
To interact with the “gpt-4o” it is necessary to have an OpenAI library. All the rest is Python standard library. As you can see, this is the basic tech stack a Data Scientist uses in day-to-day activity. The novelty is LLM.
What I would change next time
If you are familiar with working with LLM frameworks, you will probably say that I should have used a framework like LangChain to streamline the process. I wanted to control each step of the process to understand what the right way is to work with an LLM. For sure, in the next project I will use that framework.
By the way: If you’re quite interested in LLMs, check out this article on pre-training and fine-tuning LLMs!
Highlights of Data Chat
1. The look and feel
You will probably laugh, but a great deal of time I spent on giving Data Chat dashboard a nice look. And with all of that, I think I have done a mediocre job on the visual side. My knowledge of HTML and CSS is limited. Do you agree that people are more likely to choose a product that looks better over one that works better?
Highlighting the importance of proper visualization – our colleague Laura Wiegmann has already explored the visualization of Jira Data in her previously published article.
2. Prompting
To get the best out of the model, you need to create a very good prompt that emphasizes what is expected from the model, what is the input, what is the output and what are the constraints. I am not exaggerating, but I changed the prompt tens of times. And still, I get new ideas for improvements.
One tip, focus on examples and give a general one from each use case.
3. Format the response
Although it is specified in the prompt and added as an argument, sometimes the format of the response will break. Make sure to check it before it is processed. When the model generates code, it is even more important to verify and correct the response when necessary. If a space is not well placed in the code, you will get an error.
4. Execute the code
As I said previously, the result of the code can be text, plot or changes to the table. One of the hardest parts was to determine the type of result. It needs to be placed in the right area of the dashboard. Plots are quite tricky because they are generated as text (dictionary to be more precise). The solution was a good old regex that saved the plot rather than showing it.
Be the User You Design it for
What you see now is the 3rd version of the project. The first version of the project was working in the Terminal, and I presented it to my colleagues in Romania. To make the presentation short, I created the questions in advance.
A colleague from Data Analytics said the questions were too specific and technical. And she was right. I was thinking like a Data Scientist and recommended the product to people without experience in the domain.
Final Thoughts
I do not encourage you to use Data Chat. I encourage you to use this controversial technology Generative AI, either for fun or for work. You cannot know when fun turns into actual work.
What I noticed is that LLM reminds us of how to communicate in a clear and easy to understand way. Otherwise, we won’t get the expected results. It is just the way we should communicate one with each other. It is a revolution in the quality of communication.
Author info